Using the dashboard
Performance
Open Performance on any trading workflow to see how it has done.
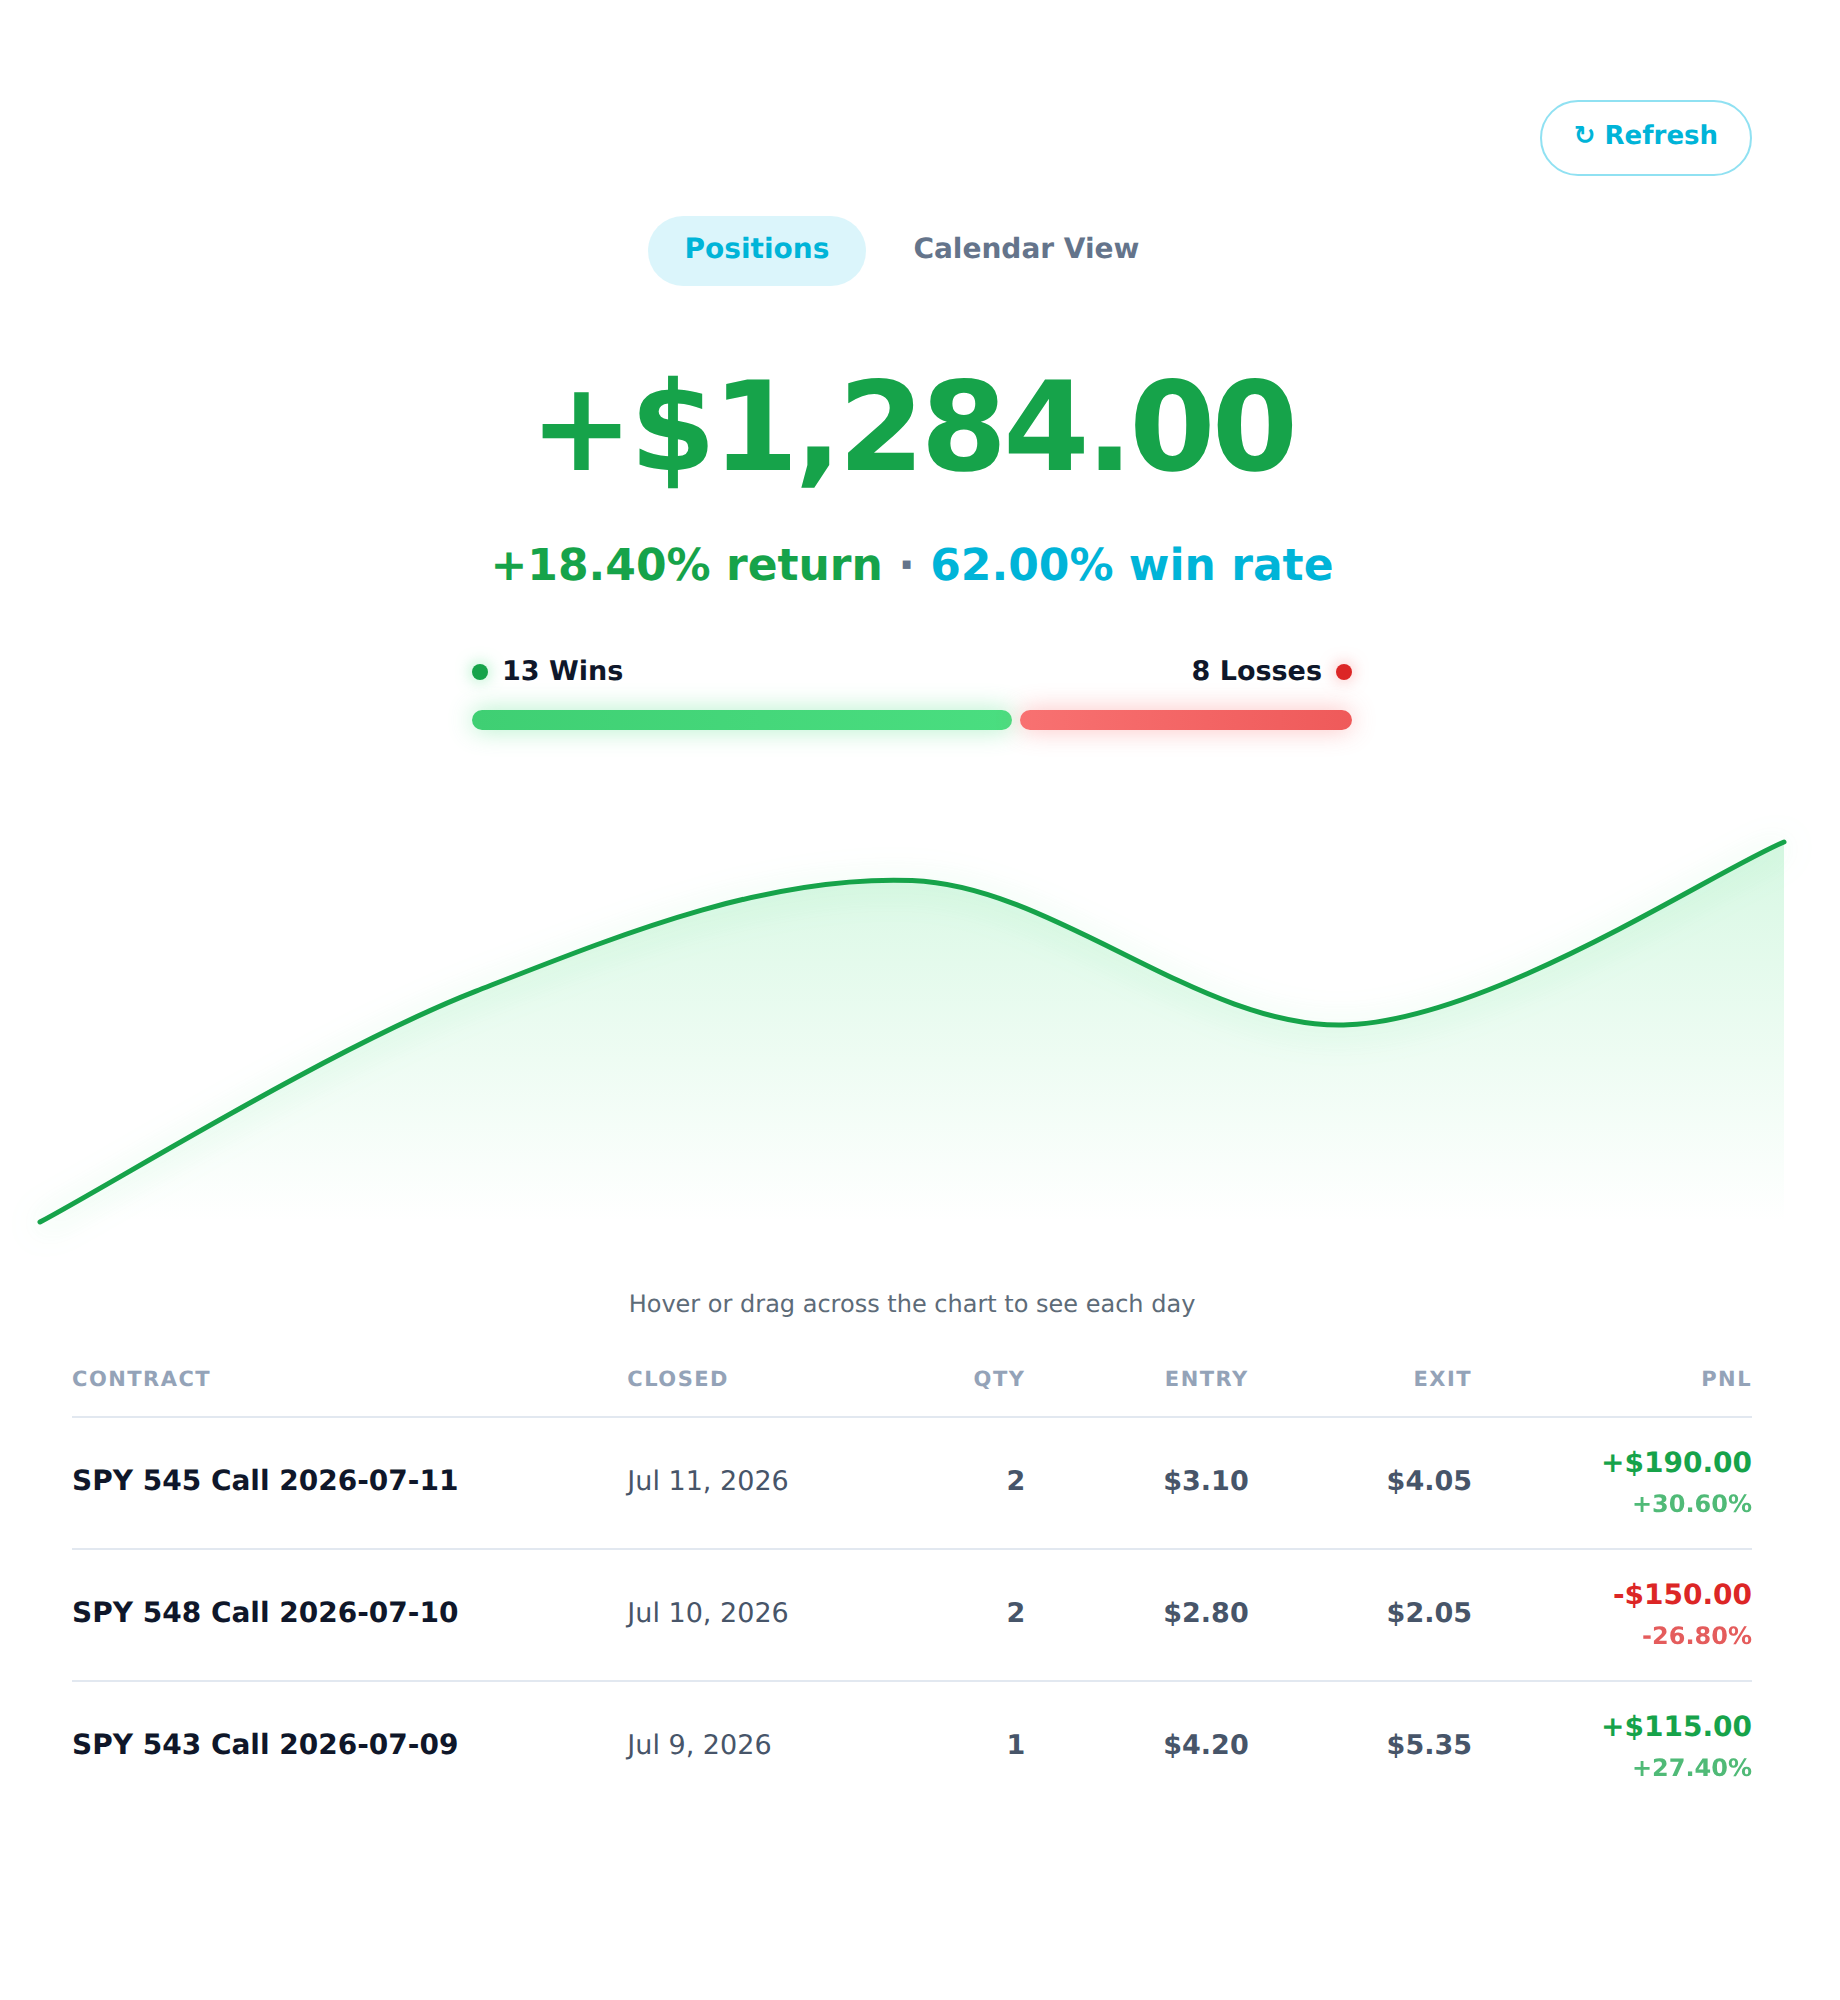
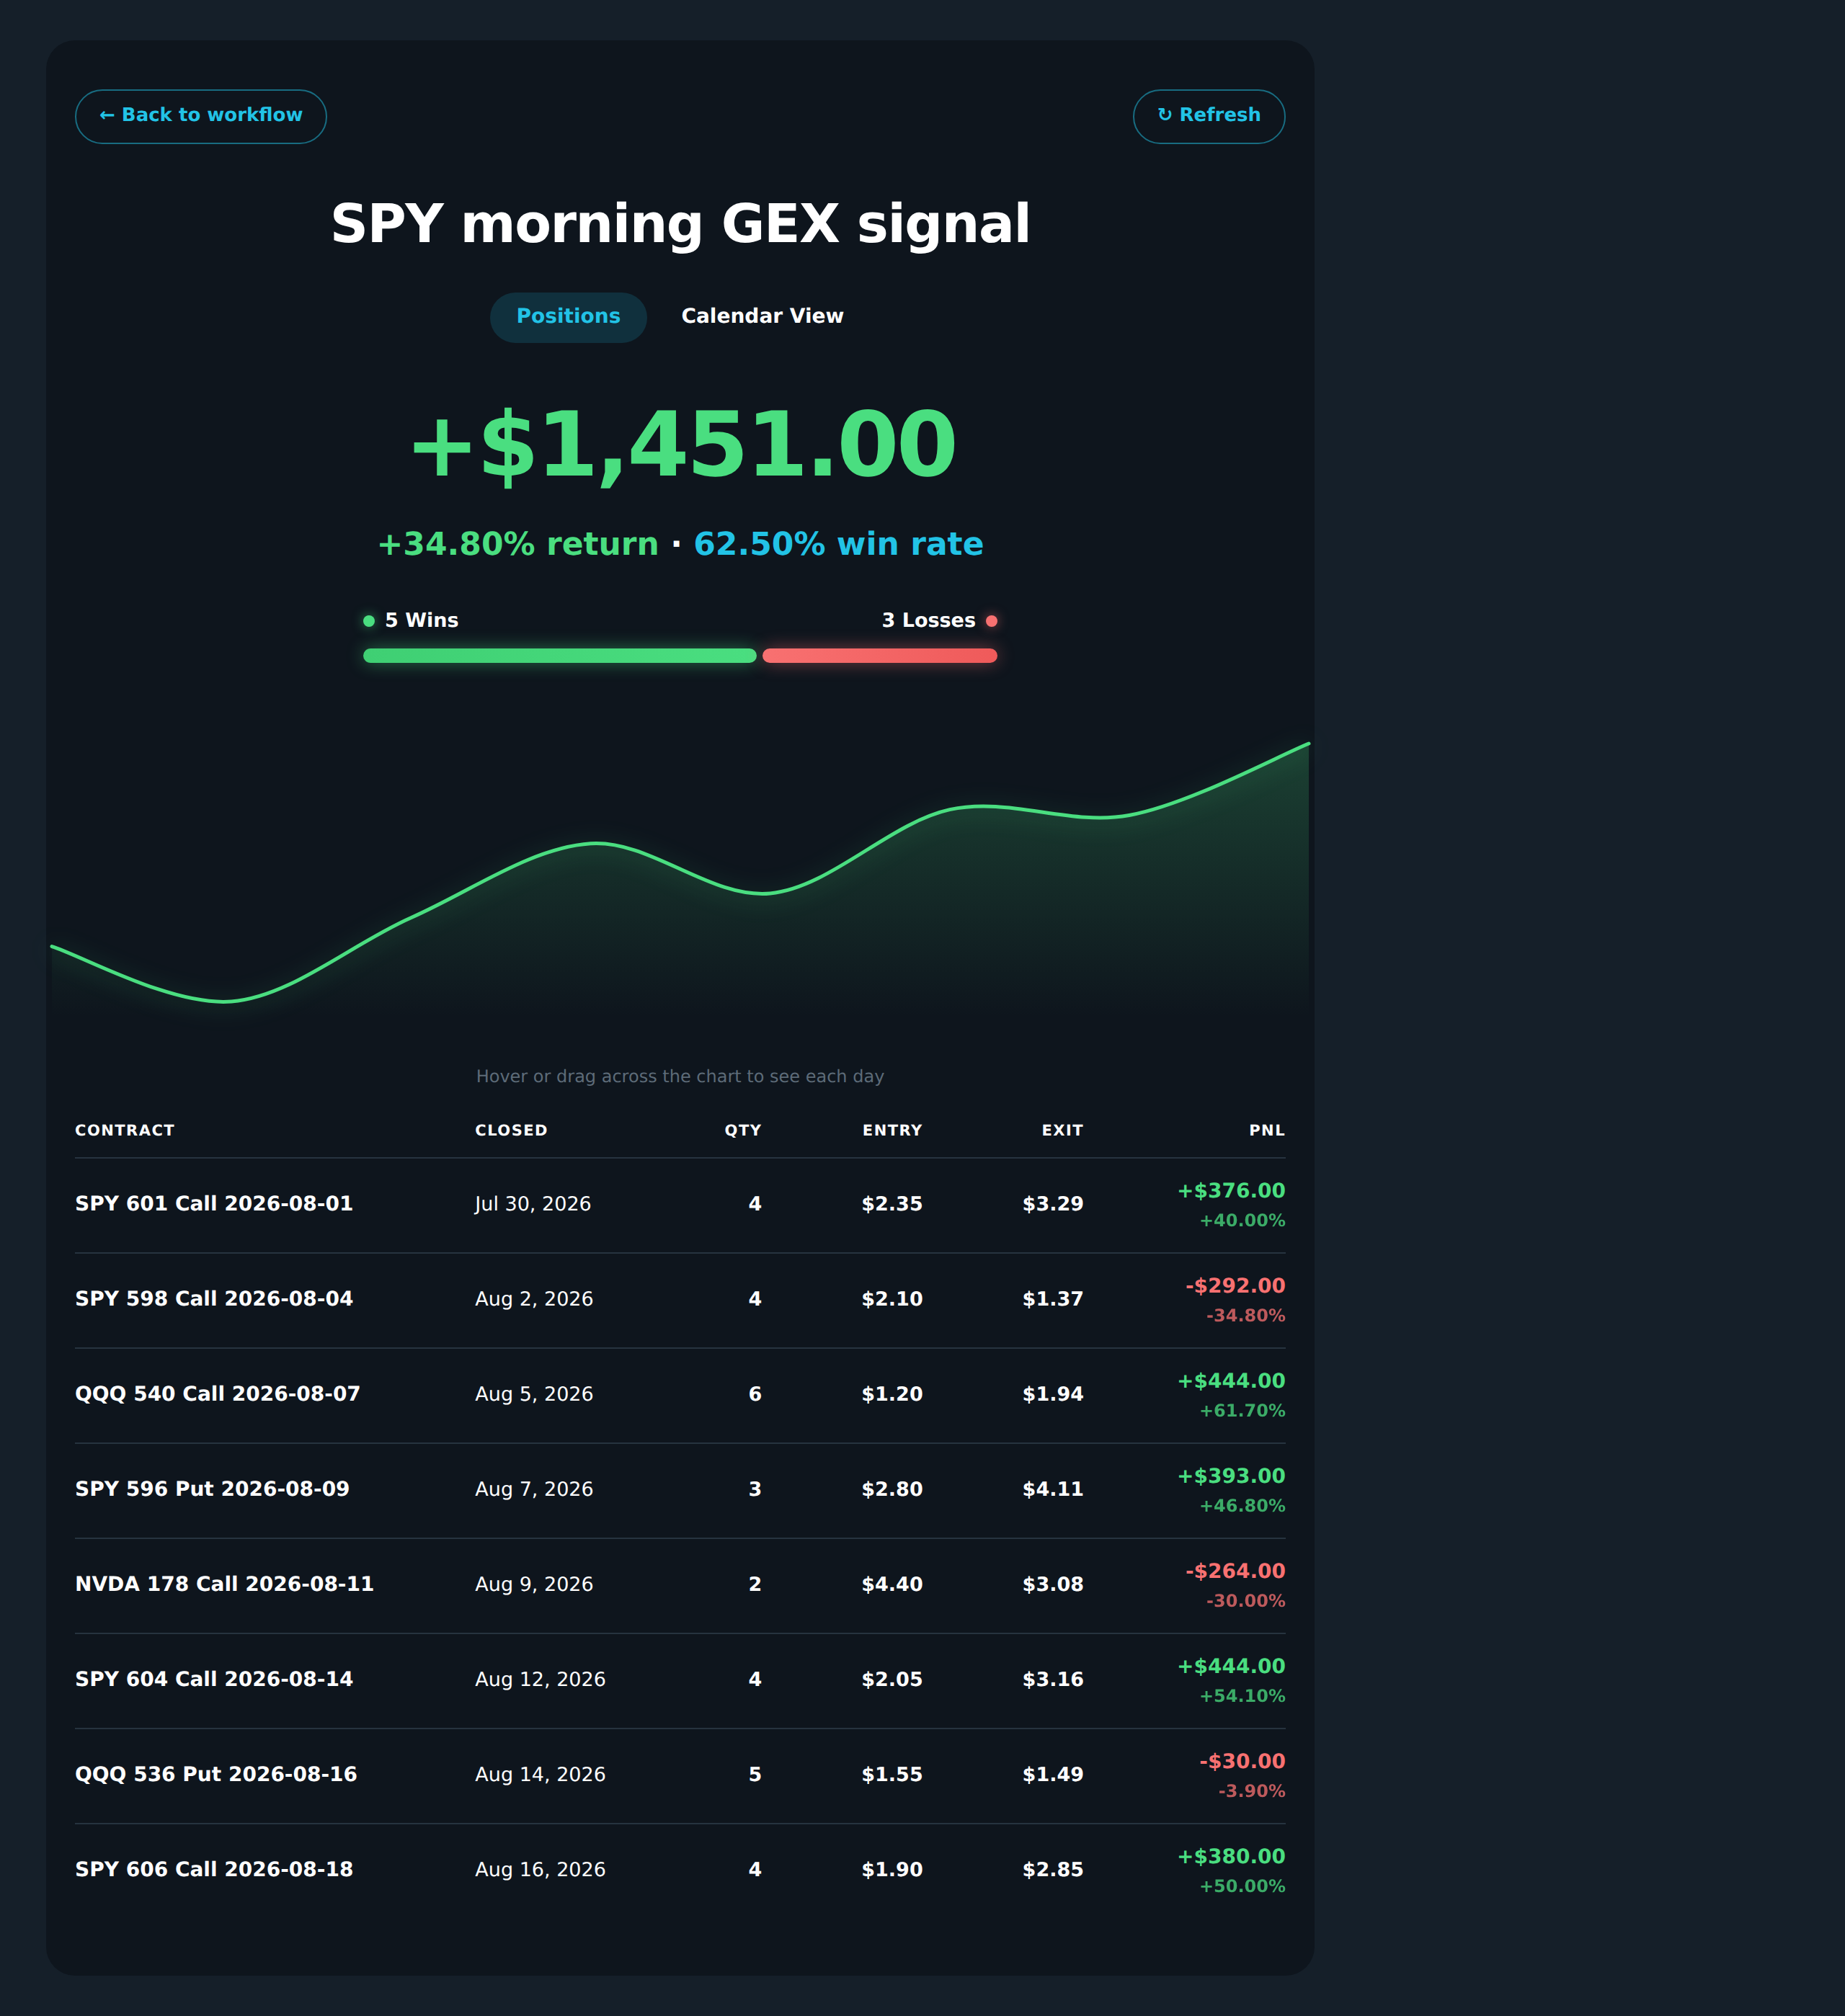
- Top numbers: total profit or loss, win rate, and number of round trips.
- Table or calendar: one row per close with the date, stock, side, amount, entry, exit, and profit or loss.
- Sync broker: matches the rows to your broker in one go.
Each workflow shows its own money at your size, so a copy shows its own results, not the author's. Every close makes a row. If a number is not ready yet (a gap in prices or a manual close), it shows a dash instead of a blank.